This season I tracked everyday (with the exception of a couple of errors) snowboarding at the ski resort Whitewater, BC, Canada. Overlaying all the data in Google Earth creates this super interesting effect.
Click below to read more about this project…
Update: I’ve created this interactive map using GPS Visualizer and Google maps. Download the KMZ file here to play with it in Google Earth.
Tracking outdoor activities is something I enjoy doing. It’s nice to be able to see where you went and look at things like max speed etc.
After a couple of days at Whitewater I had the idea of trying to track every day I was at the hill for the entire season. I wanted to see where I had been and where I had left to explore. As time when on, the mountain slowly turned blue and patterns started to emerge. I was able to see where I hadn’t been and areas that I travelled a lot. Remembering to set it off tracking every day was a mission. I was surprised that I was able to get a full day of data on one battery.
Some Info:
- Tracked with the iPhone 5
- MotionX-GPS used to record the data
- Total distance approximately 2200km / 1370mi
- Average distance per day 35km / 21mi
- Total descent/ ascent 260,000m / 853 000ft
- Average time 5 hours per day
- 66 tracked runs
- Max speed 118km/h / 73mph
- Date range 10 Dec 12 – 14 Apr 13
Aerial view from Google Earth of Whitewater Ski Resort with all the tracking data overlaid.
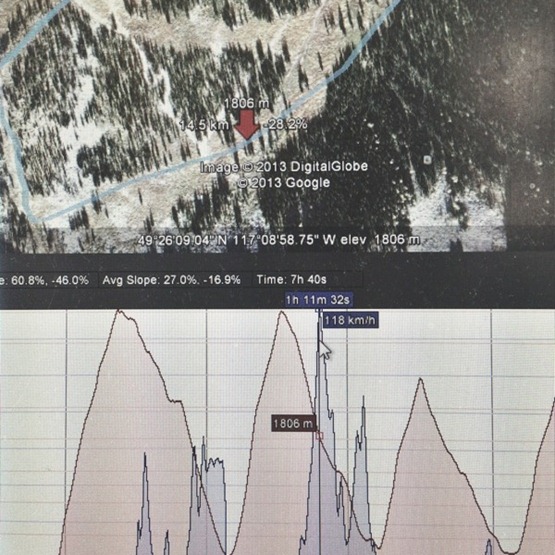
As mentioned in the stats above I clocked a new personal best top speed. The conditions that day were perfect. The resort was empty, the snow was hard but not icy and my board had been recently waxed. I decided to straight line it from the top of one of the runs and get as low as I could. I knew I was going fast because the air resistance was intense. It felt like I was ready to take off.
When I got to the bottom and looked at the phone I was stoked to see I finally beat my previous top speed of 101kmph by 17kmph! The road speed limit here in the UK is 70mph, at this point I was going 73mph. It’s kind of scary to think I was traveling this fast on a board…
There were a couple of days where I forgot to turn off the tracking data as we got in the car and left the resort. I ended up tracking some of the way back into the closest town, Nelson. This would have skewed the results a little, but not enough to have a major impact. You can see the road leaving the resort at the bottom right of the image below.
View of the ‘Short Side’ of the resort. There are no groomed runs in this area, but there is some great lines to be had through the trees. The only issue with dropping in here, was the traverse at the bottom back to the lift. This is why this section of the mountain is less covered than the others.
The thicker straight blue lines are the lifts.
Below you can see where we went for hikes.
View of the resort looking west from Ymir peak.
Close up view of the runs.
So there it is, 5 months of snowboarding tracked. I’m very much looking forward to my next visit to this amazing resort. I can use this data to work out what spots still need to be filled in on the next map 🙂


Recent Comments